Troubleshooting
During this lab you may encounter warnings and errors, solutions to the most common ones are shown here.
Self-signed certificate warning
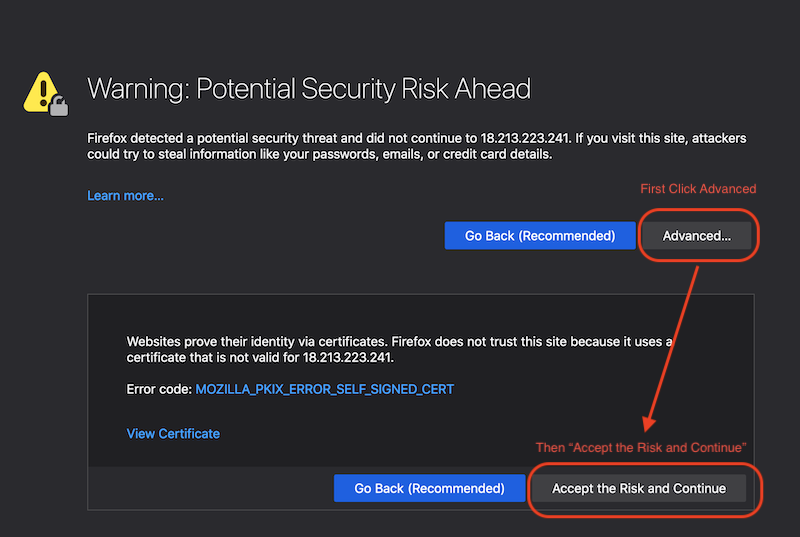
If you cannot connect to the Grafana dashboard with an error like Your connection is not private switch to firefox and follow the instructions below.
The connection to the dashboards will go through HTTPs using a self-signed certificate. There’s nothing inherently unsafe about this, all it’s saying is use caution since the keypair that was used to sign the certificate isn’t in the browser’s root trust store. For the purposes of the demo we can click Advanced…, then Accept the Risk and Continue:
Grafana produces an error 502
We noticed in some occasions that the Grafana container could not be fetched from DockerHub. A solution is to launch it manually on the head-node by running the command below. Replace <HEAD_NODE_PUBLIC_IP> by your head-node public IP and run the command in your terminal.
docker run --name grafana --net host -d --restart=unless-stopped -p 3000:3000 \
    -e GF_SECURITY_ADMIN_PASSWORD=Grafana4PC! \
    -e GF_SERVER_ROOT_URL="http://<HEAD_NODE_PUBLIC_IP>/grafana/" \
    -v /home/$cfn_cluster_user/grafana:/etc/grafana/provisioning \
    -v grafana-data:/var/lib/grafana \
    grafana/grafana