g. Compute nodes monitoring
In this section, you will run a simple MPI Uni-directional network bandwidth test on 2 Compute Nodes from the Intel MPI Benchmark Suite and monitor the Compute Node job metrics in the Compute Node Details Dashboard.
- In the AWS Cloud9 terminal login to the head node of your cluster as below:
pcluster ssh perflab-yourname -i ~/.ssh/lab-4-key
- Create a Slurm MPI job script as shown below.
cat > job2.sh << EOF
#!/bin/bash
#SBATCH --output=slurm-%j.out
#SBATCH --nodes=2
#SBATCH --time=10:00

 module load intelmpi
 export I_MPI_DEBUG=5

 mpirun -np 4 -ppn 2 IMB-MPI1 Uniband -npmin 4
EOF
- Submit the script to SLURM using the SBATCH command as follows:
sbatch job2.sh
-
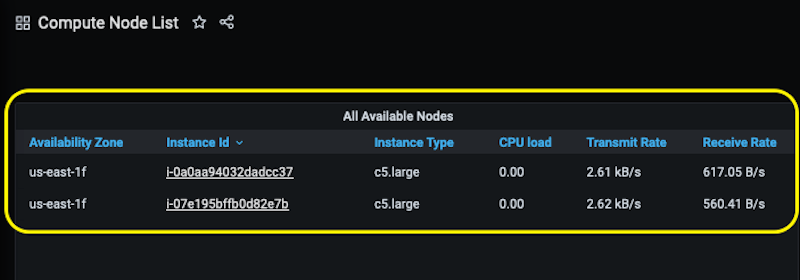
Go back to the Grafana Dashboards in your browser and navigate to the ParallelCluster Stats Dashboard. Once the job is in Running state, switch to the Compute Node List dashboard. You should see 2 Compute Nodes allocated (since the Slurm MPI job requested for 2 nodes).
-
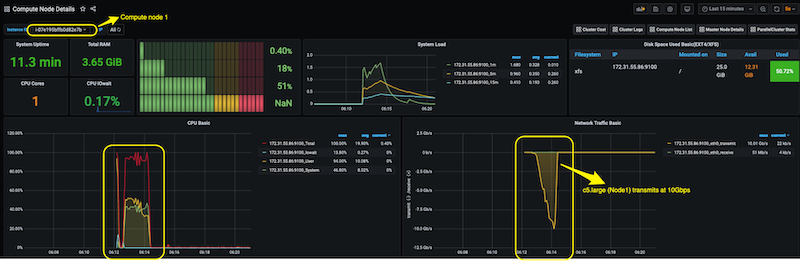
Now, navigate to the Compute Node Details Dashboard. Since we ran a network bandwidth test on 2 compute nodes, we monitor the network traffic on both compute nodes.
We are running on c5.large compute nodes which can deliver a network bandwidth of upto 10 Gbps. you can see this in the Network Traffic stats in the Compute Node Details dashboard