e. Interactive dashboard monitoring
In this section, you will run a tool called stress-ng on the Cluster Head node and monitor the different metrics in the Master Node Details Dashboard.
In the AWS Cloud9 terminal login to the head node of your cluster as below. Type yes when prompted.
pcluster ssh perflab-yourname -i ~/.ssh/lab-4-key
Install the stress-ng tool
stress-ng is a stress test tool which is designed to exercise various physical subsystems of a computer system as well as various operating system kernel interfaces. It provides over 240 stress tests including CPU, virtual memory and I/O specific stress tests.
Install the stress-ng tool on the head node of your cluster as follows:
sudo yum -y install stress-ng
Now, we’ll run some stress tests and monitor the performance metrics in the Grafana Dashboard. Since you will be running these tests on the Master Node, you will look for the metrics in the Master Node Details Dashboard.
CPU STRESS TEST
- In you cluster head-node, start 4 workers exercising the CPU (spinning on
sqrt(rand()))
stress-ng --cpu 4 --timeout 120s --metrics-brief
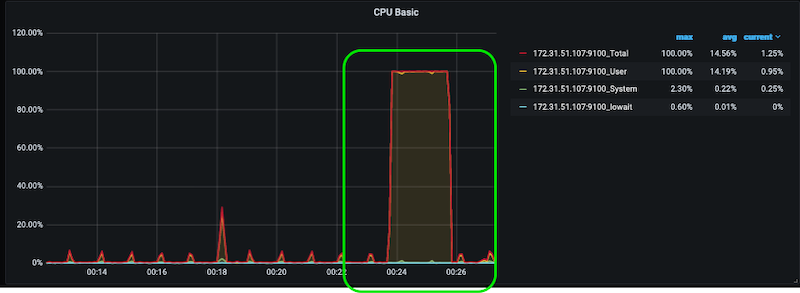
- Go back to the Grafana Dashboards in your browser and navigate to the Master Node Details Dashboard. The Master node is running on a c5.xlarge which has 4 vCPUs. Since the cpu stress test is running for 2 mins on 4 workers, the CPU utilization should be 100% for the duration. The CPU Basic in the dashboard should look like below:
MEMORY STRESS TEST
- Now, let’s stress the memory. Use mmap N bytes per VM worker. mmap is a utility to create a memory allocation in the process address space. You can specify the size as % of total available memory or units on Bytes, KBytes, MBytes and GBytes using the suffix b, k, m or g:
stress-ng --vm 4 --vm-bytes 1G --timeout 120s --metrics-brief
-
The
--vm 4will start 4 workers continuosly calling mmap/munmap and writing to the allocated memory. -
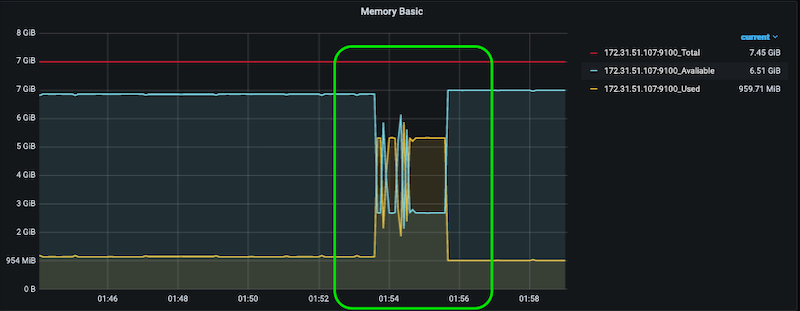
The Memory Basic in the dashboard should show the utilization of 4 GB of physical memory for 2 minutes as below:
DISK I/O STRESS TEST
- Run a simple directory thrashing stress test as below:
stress-ng --dir 4 --timeout 120 --metrics-brief
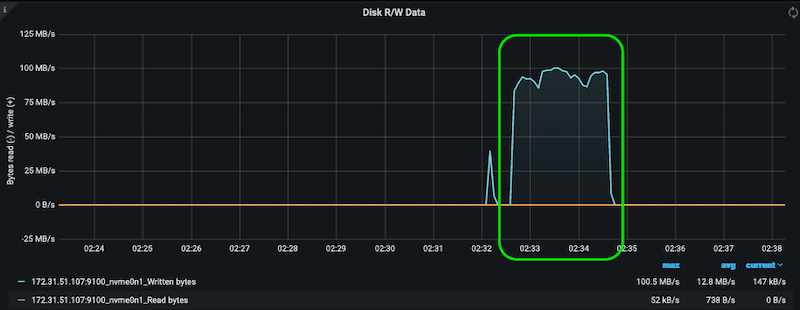
- This starts 4 directory thrashing stressors, writing to the disk. You should see the write bandwidth increase in the Disk R/W Data dashboard as below:
PUTTING IT ALL TOGETHER
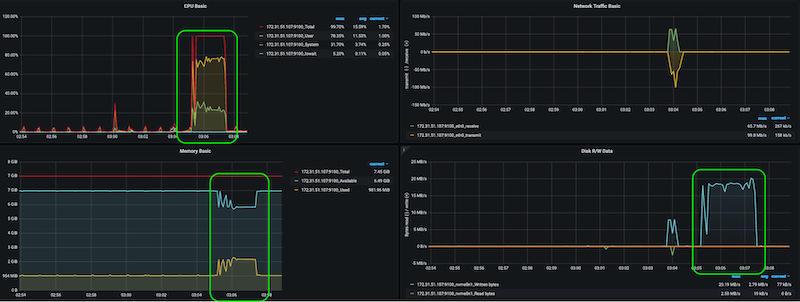
- Run for 120 secs with 2 cpu stressors, 1 dir stressor and 1 vm stressor using 1 GB of virtual memory
stress-ng --cpu 2 --dir 1 --vm 1 --vm-bytes 1G --timeout 120 --metrics-brief
In the next section, you will monitor the performance of the compute nodes in your cluster.