d. Review the grafana dashboards
In this section, you will review the Grafana Monitoring Dashboard that’s created as part of your cluster.
Grafana Dashboards
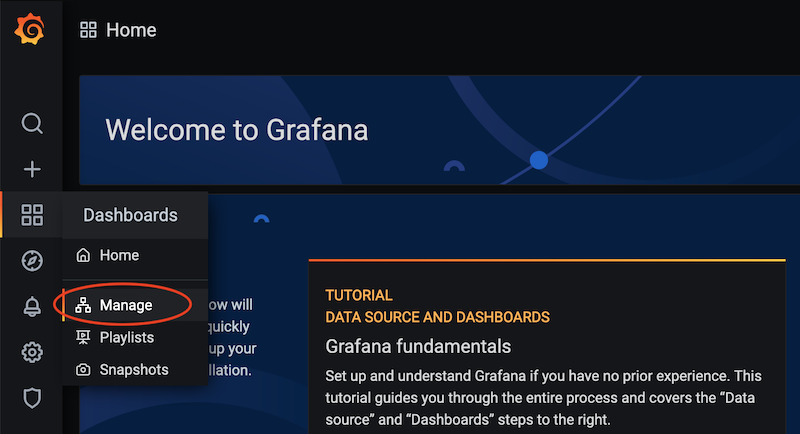
In the welcome page, click on the Dashboards button then select Manage as shown below
In the Dashboards page, you can see 6 different dashboards which can be further customized or used as is:
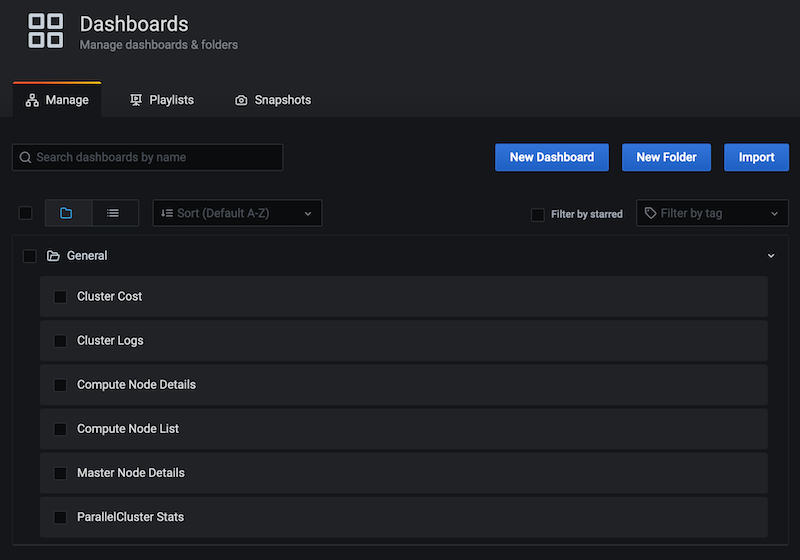
Click on each of them to see the detailed monitoring information. Note that some of the dashboards (e.g. Compute Node List, Compute Node Details) will not show any information until a job is launched (since we start with zero compute nodes in our cluster to save costs).
| Dashboard | Description |
|---|---|
| ParallelCluster Stats | This is the main dashboard that shows general monitoring info and metrics for the whole cluster. It includes Slurm metrics and Storage performance metrics. |
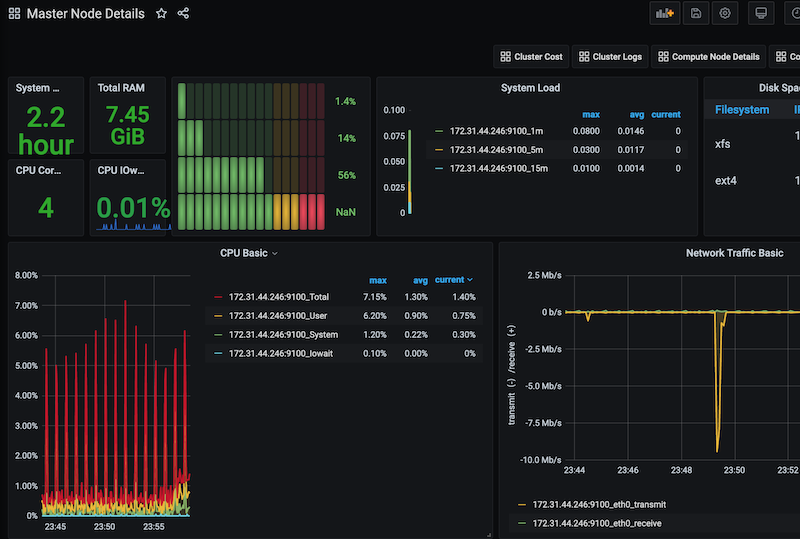
| Master Node Details | This dashboard shows detailed metric for the Master node, including CPU, Memory, Network and Storage usage. |
| Compute Node List | This dashboard show the list of the available compute nodes. Each entry is a link to a more detailed page. |
| Compute Node Details | Similar to the master node details this dashboard show the same metric for the compute nodes. |
| Cluster Logs | This dashboard shows the logs of your HPC Cluster. The logs are pushed by AWS ParallelCluster to AWS ClowdWatch Logs and finally reported here. |
| Cluster Costs | This dashboard shows the cost associated to every AWS Service utilized by your Cluster. It includes: EC2, EBS, FSx, S3, EFS. |
For example, here’s what the Master Node Details dashboard looks like: