c. Login
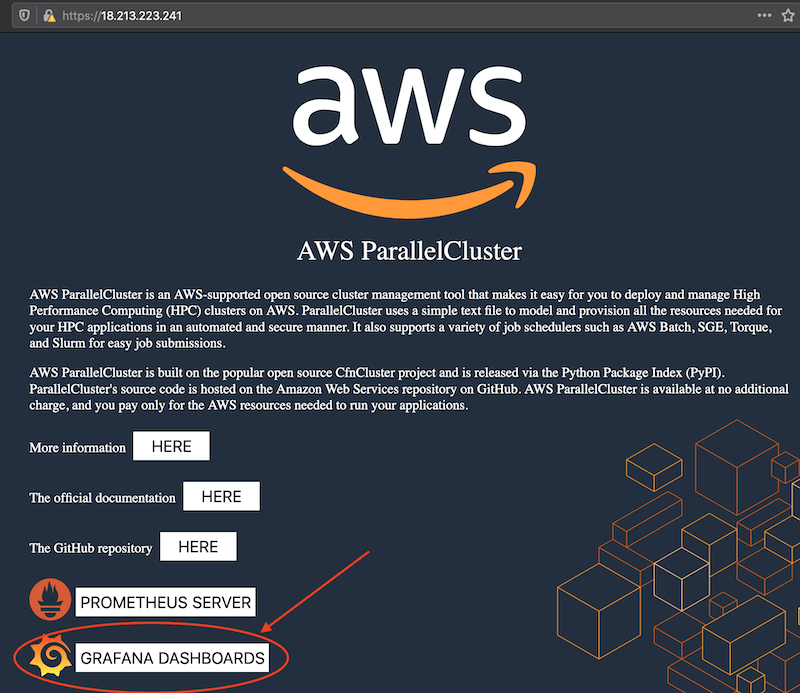
After your cluster is created, you can open a web-browser and connect to head node of your cluster using its public ip. A landing page will be presented to you with links to the Prometheus database service and the Grafana dashboards.
Login
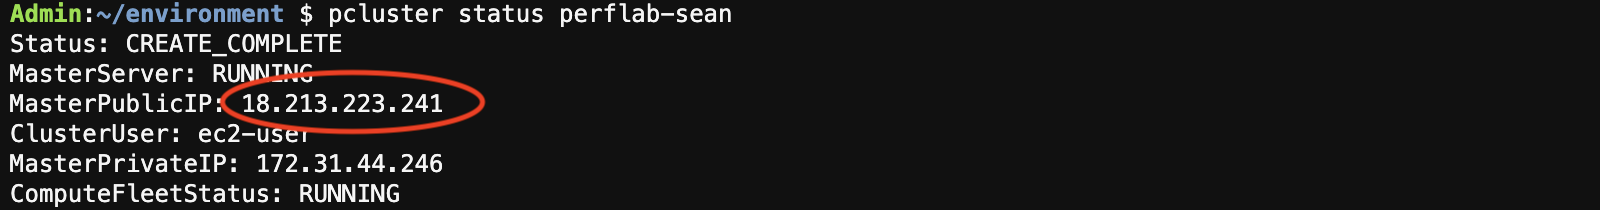
To get the public ip of the head node of your cluster using the pcluster status command as follows:
pcluster status perflab-yourname
You should see an output similar to the one shown below
Open a browser (e.g. Chrome or Firefox) and connect to the head node of your cluster using the public ip address https://PUBLIC_IP. Click on GRAFANA DASHBOARDS on the landing page as shown below:
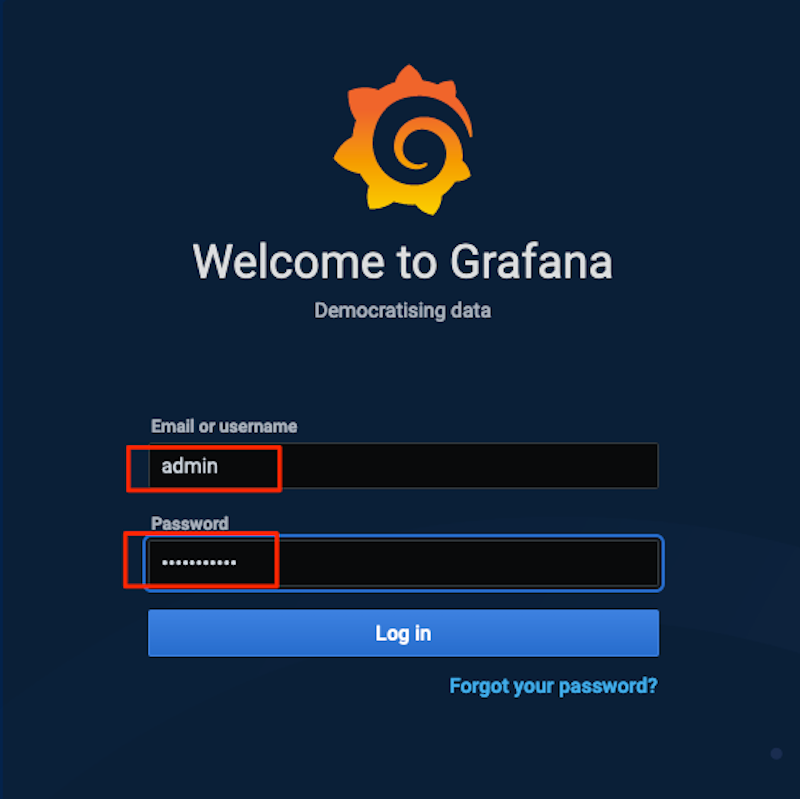
Login to the Grafana dashboards using the below username and password
| Field | Value |
|---|---|
| username: | admin |
| Password: | Grafana4PC! |
If you cannot connect to the Grafana dashboard with an error like Your connection is not private switch to firefox and follow the instructions here
If you modified the username or password in the post_install script when deploying the cluster, use the updated credentials.